

Data Analysis
PART 2.2
Radiation Dose
A dose rate measured in microsievert per hour (Sv/h) is a measure that describes the health risk per hour associated with ionising radiation. This is a valuable measurement, as it helps people assess the safety risks of working in radioactive environments.
Below is a graphic that depicts the radiation dose in microsieverts. It ranges from the radiation one would get from digesting potassium when eating a banana (0.1 Sv), to experiencing the Chernobyl nuclear explosion (50 Sv).
According to the chart, a typical flight from New York to Los Angeles, which is approximately six hours in duration, would be a dose of 40 Sv.
To put this in perspective, 8 Sv is a fatal dose for humans. One would have to consume 80 million bananas or fly from New York to Los Angeles over 200 thousand times for the radiation to have a serious, life-threatening effect.
Calculate the Total Radiation Dose on your Flight
If you would like to calculate the total radiation dose of your flight, use the code below. This code plots the same graph as in the Part 1 Visualisation section. Refer back here to see how to adjust the code for your data.

Accessed from: https://xkcd.com/radiation/ on 14/07/2023
CARI-7
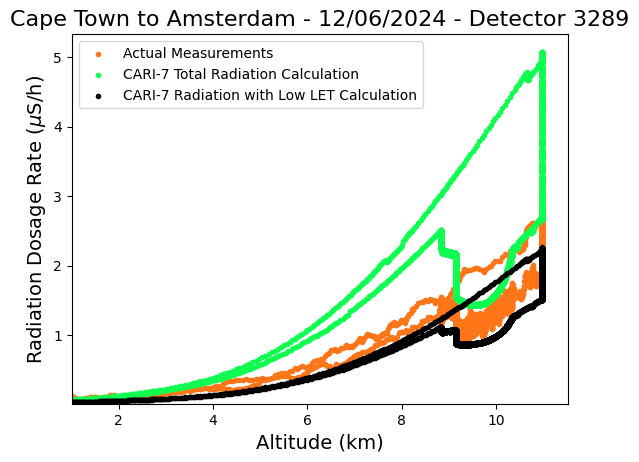
As explained earlier, the radiation rate should increase with altitude, as the number of shielding atmospheric particles between the airplane and primary cosmic rays decreases as the plane’s altitude increases.
For flight crew and astronaut safety, many aviation agencies need to be able to predict the radiation dosage at various altitudes. CARI-7 is a very useful tool for doing this. It is a computer program that was designed by the Federal Aviation Administration's Civil Aerospace Medical Institute. CARI-7 makes use of geographic coordinates and changes in solar activity to simulate and calculate the cosmic radiation experienced by a person on board an aircraft.
Plot your Radiation Dose
To compare the CARI-7 simulated levels to your measured levels and to evaluate how they change as a function of altitude, the steps and video below will help you download and use CARI-7 for your own data.
Step 2: Convert your new .log file
Once you have CARI-7 downloaded, you will need to convert your data into a format CARI-7 can use. The code below does this for you. Ensure that you have run Part 2.1 of the Analysis before doing this, as this code uses the new .log file created in the code from Part 2.1 as the input file.
Step 3: Run the converted file through CARI-7
Now open the CARI-7 application and run your converted file through the program. The video above will show you exactly how to do this. If you would like to find out more about what CARI-7 can do, you can refer to the user manual here.
Step 4: Access and run the code
The last step is to take the file that CARI-7 produces and input it into the code provided below. This should produce a plot similar to the one on the right.


Step 1: Download CARI-7
If you are a Linux or Windows user, click on the link below to download and run the CARI-7 software. Unfortunately, CARI-7 has not been developed for mac OS yet. If you are a mac OS user and would like to run your data through CARI-7, send your flight number and raw data to our email address (cosmiconair@gmail.com) and let us know that you would like us to run it for you.