

Flight Data Analysis Toolkit
Analyse your own radiation data measured onboard commercial flights and explore how altitude, latitude, and space weather affect exposure.
Get Started
This Python-based educational toolkit was developed by the University of Cape Town and Observatoire de Paris to help analyse and understand radiation measured during commercial flights.
Analysis workflow
Prepare detector data
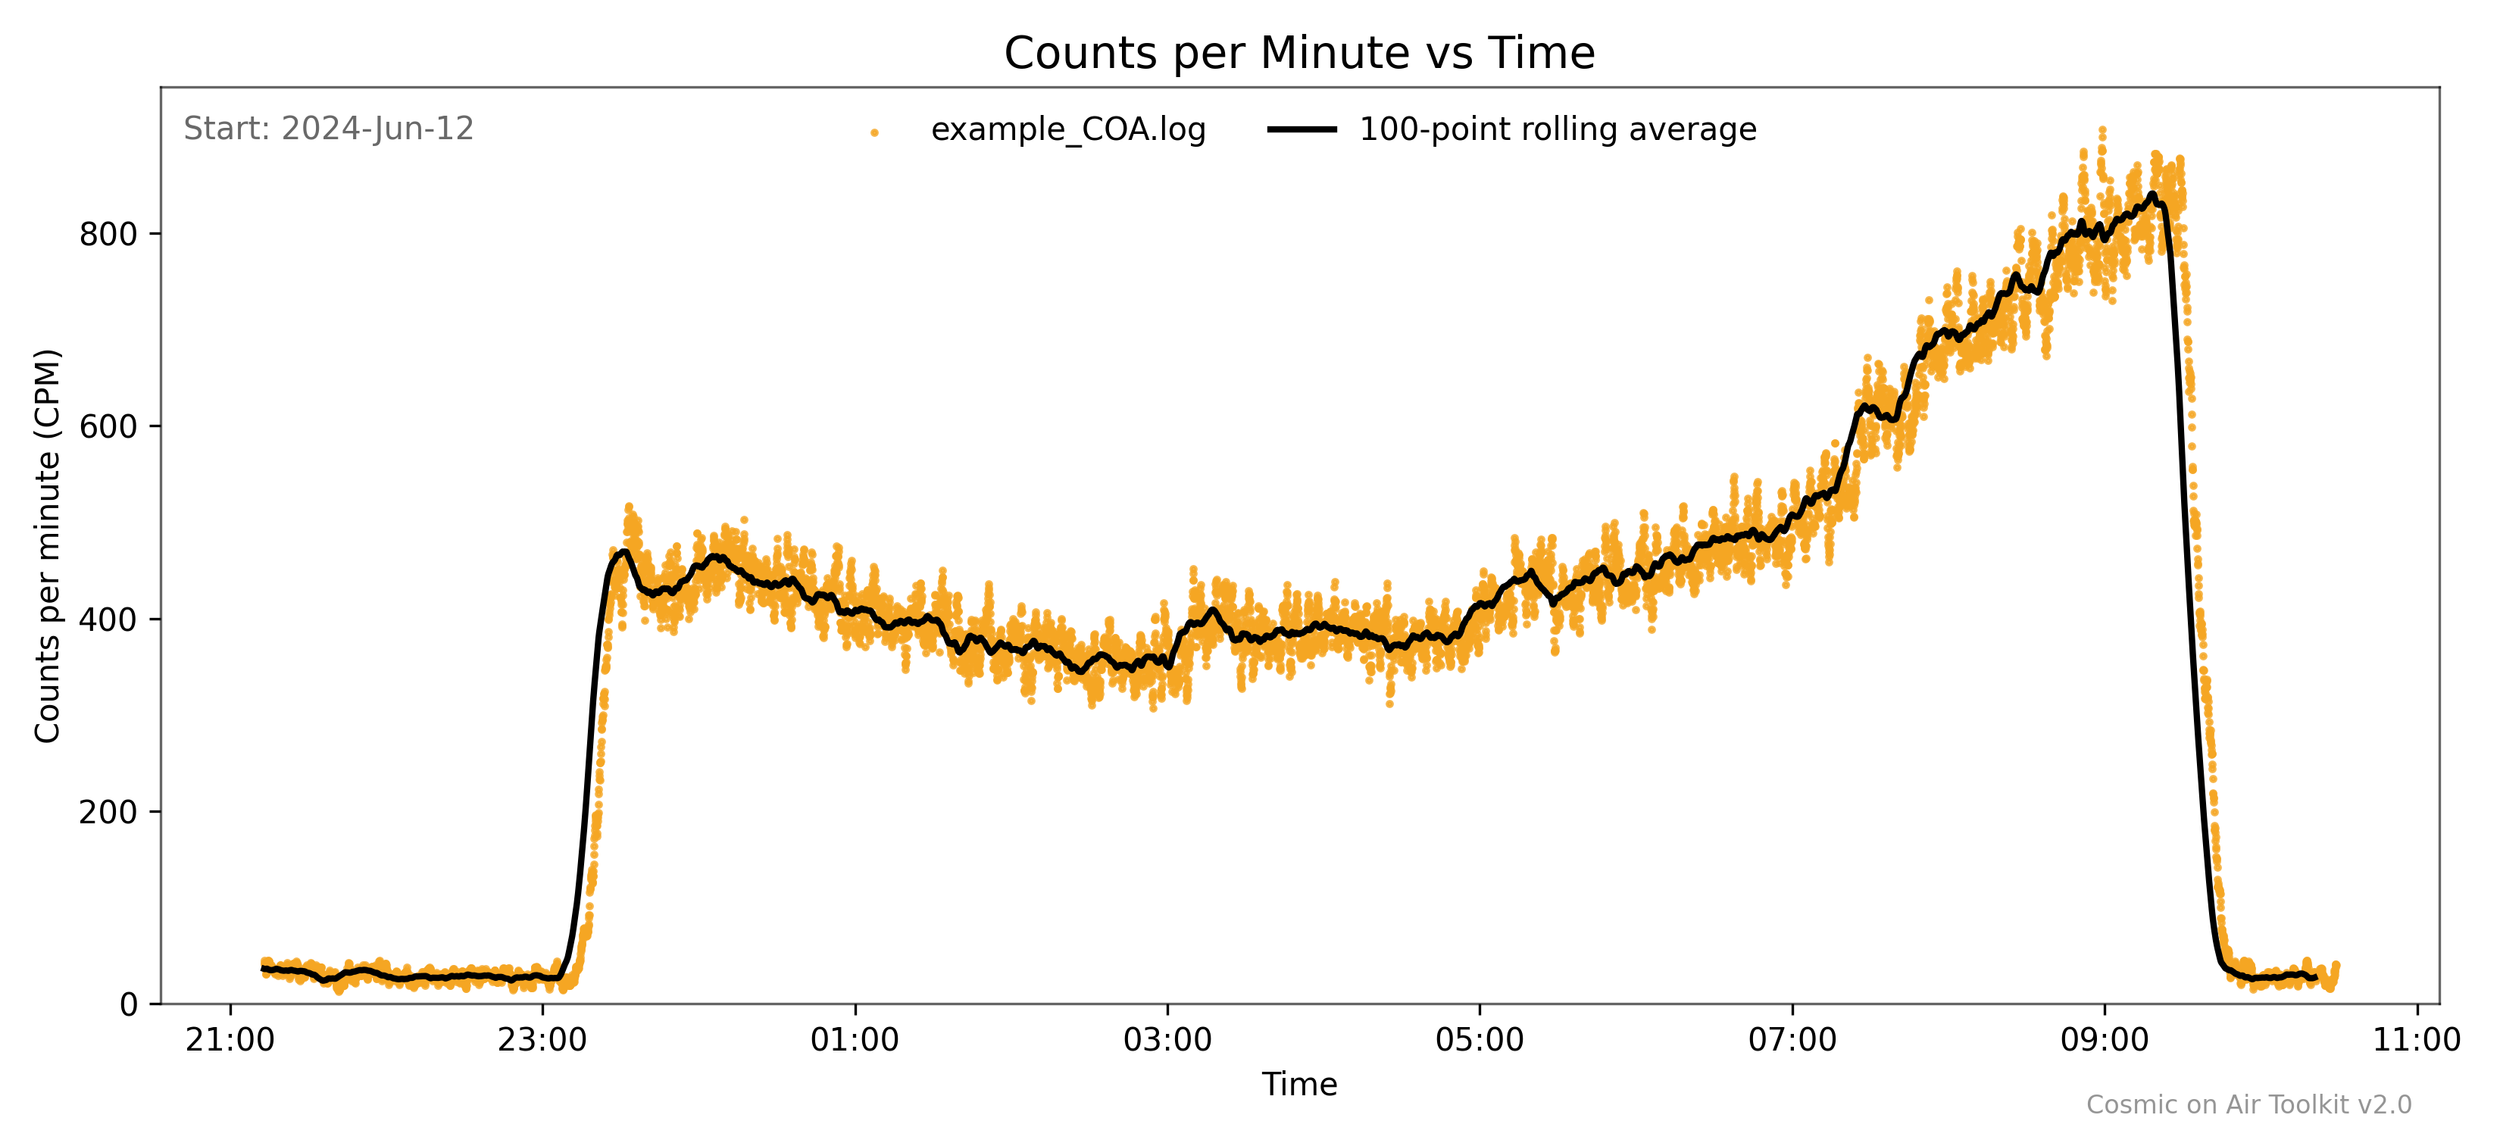
Visualise radiation measurements
Reconstruct flight path
Analyse how radiation varies during the flight
Compare with models
In rare cases, your data may include real space weather effects.
What you’ll need
Python installed on your computer
A detector dataset and flight tracking data (or use the example provided)
Basic experience running Python code
Note: If using your own dataset, please upload to our Cosmic On Air database.


Pre-flight checklist
Basic requirements
Python 3.9+
Make sure to enable “Add Python to PATH”
Terminal / command prompt basics
Introduction to command line https://tutorial.djangogirls.org/en/intro_to_command_line/
How to Run Your Python Scripts https://realpython.com/run-python-scripts/
Quick setup
The toolkit relies on the following Python libraries:
numpy (version 1.20 or higher)
matplotlib (version 3.5 or higher)
cartopy (version 0.21 or higher, optional - used for map visualisation)
Install required packages:
(Optional - for maps)
Download the toolkit
Test your setup
Before continuing with your own data, make sure your setup works:
Read the guide (also included as part of the toolkit).
Run through the steps 1 & 2 in the toolkit using the example data provided. This should display a plot with the expected climb - cruise - descent structure.

pip install numpy matplotlib


pip install cartopy
Extended Analysis
Explore different flight conditions
Cape Town → Amsterdam
Long-haul, mid- to high-latitude, equatorial crossing
Reference dataset in toolkit
Houston → Paris
Transatlantic, mid- to high-latitude
Paris → Santiago
Long-haul, high- to low-latitude (southern hemisphere)
Paris → Tokyo
High-latitude, near-polar route
Explore more advanced analyses
For advanced users who want more control over plotting, dose conversion, and publication-quality output, you can explore the Jupyter notebook-based toolkit developed and maintained by researchers at the Observatoire de Paris
Archive
Previous versions are available for reference.